How to Use a Comparison Table
This table was created using the Comparison Table Generator.
If you have a few products, plans, services, or any other offerings that differ in included attributes, your website might have a need that a comparison table can supply.
You should use a comparison table when your website visitors need to compare the pros and cons of a small number of offerings (no more than 4 or 5) based on a set of specified attributes. There are some instances where more than 5 things need to be compared, in which case you can reduce cognitive load by making row headers sticky when the table is horizontally scrolled.
In this article, we will analyze the best scenarios for comparison tables as well as some scenarios where comparison tables are not ideal.
What is a comparison table?
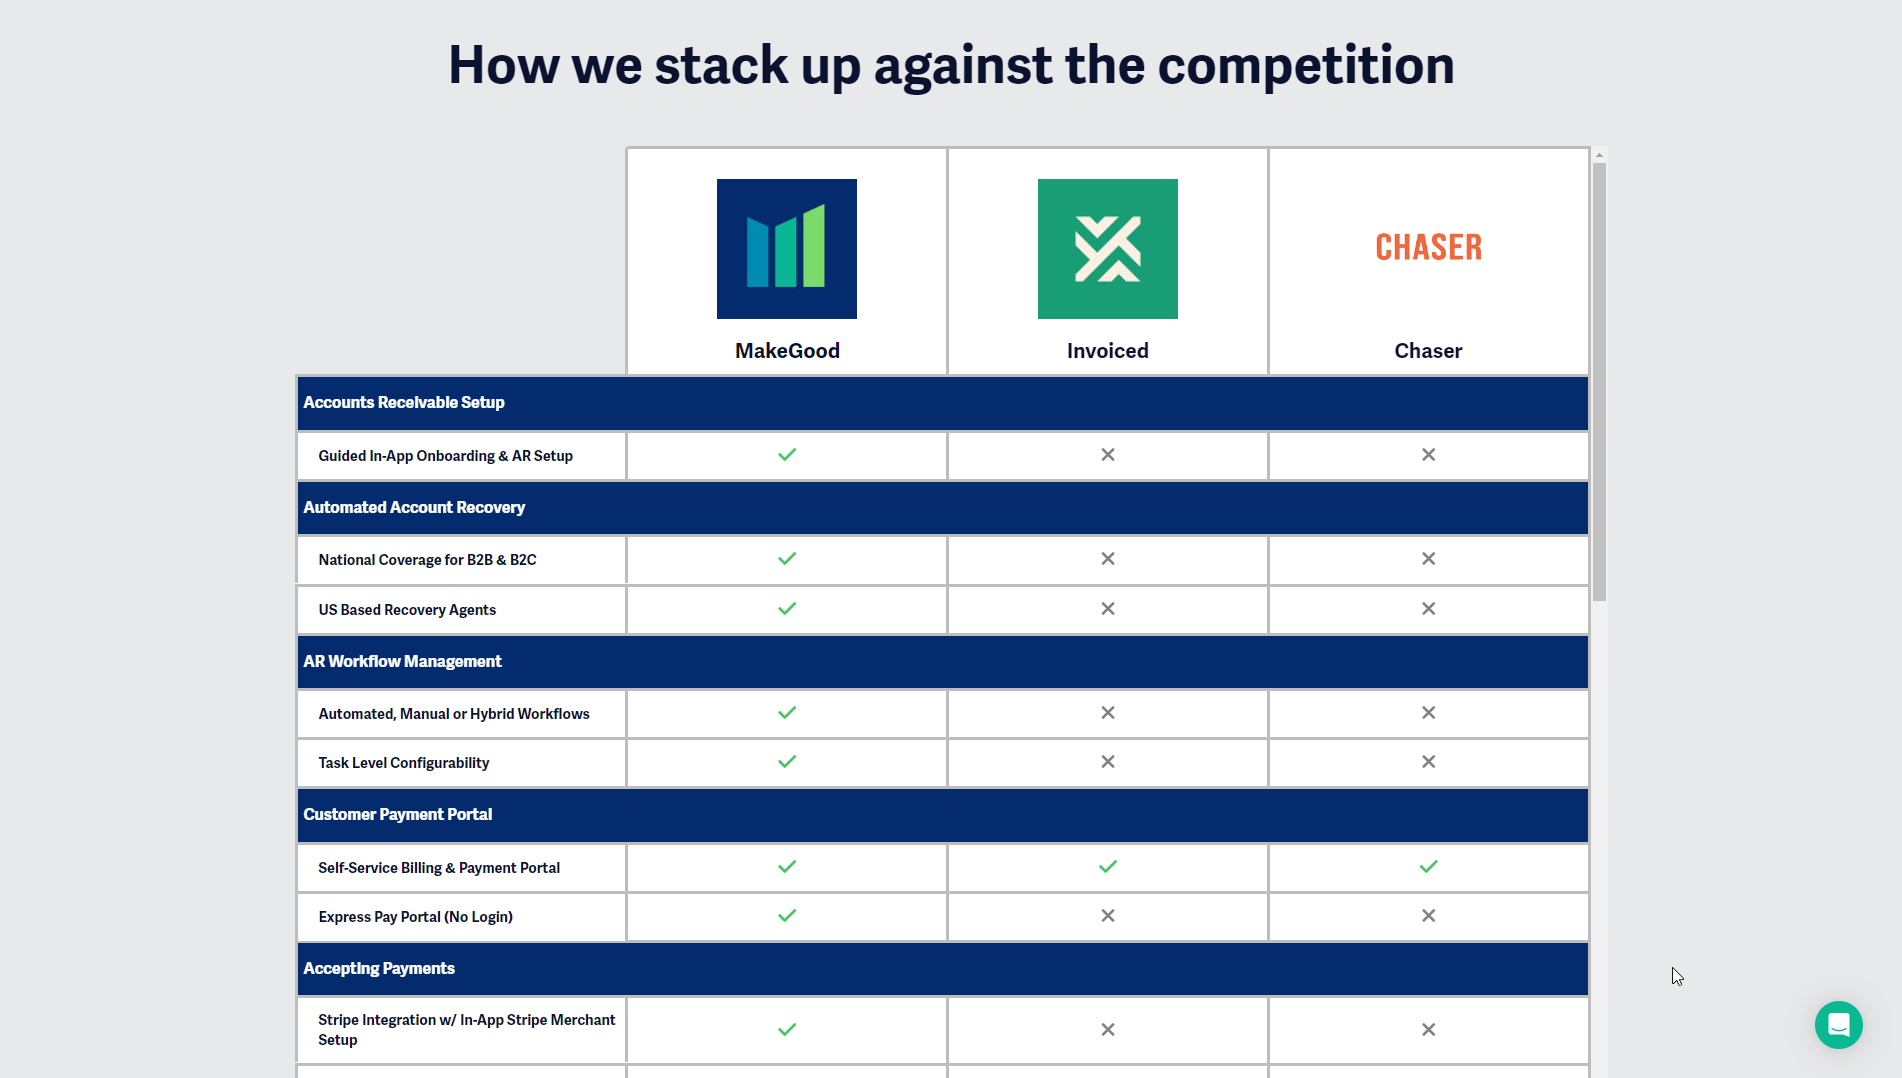
A comparison table is a tool used to compare a small number of different items or services in the columns, based on the attributes being compared in the row headers. The table data includes an indicator icon or text that signifies if the attribute is included in a corresponding offering. Comparison tables that are well-designed have proven to be the superior method for comparing products, plans, services, locations, and a multitude of other things, but even still, a comparison table is better suited for certain scenarios than others.
Use a comparison table when …
No more than 5 offerings need to be compared
Let me start off by saying sometimes, this rule is just impossible to follow; it really depends on the context of the scenario. That being said, the purpose of comparison tables for products or services is to reduce the amount of cognitive load (how much work a user has to exert to understand something) required when comparing different items. Typically this works optimally when the number of offerings is 5 or less, but when you start adding more products, the cognitive load in the user is increased, because of the following reasons:
The user now has to visually scan more columns which takes more time
On mobile devices, horizontal scrolling is required to view all columns, which requires more work from the user.
Since it isn’t feasible to have sticky row headers and column headers at the same time, the user will inevitably lose the context of one of these. This will force them to remember the corresponding items or attributes for the table data cells they are focusing on.

Amazon utilizes a comparison table to show the similarities and differences of 6 different external batteries. They do a pretty good job considering the number of products being compared is more than the ideal amount (4), but there are two things that can be improved:
The dash “-” symbols signifying that an attribute is missing should be consistent with the rest of the table by using words or phrases to signify if an attribute is included or not.
The number of products being compared is more than 5, which means the user will have a slightly more difficult time consuming the information. Sometimes, this cannot be helped because it is necessary to compare more than 4 offerings, although it is not ideal, especially for mobile viewers.
If you have a need for a comparison table that has no more than 4 offerings being compared, generate your own custom comparison table for your website using the Comparison Table Generator.
Sometimes it is necessary and unavoidable to include more than 5 products in a comparison table. If you think your site has a need for more than 5 products, here are a few suggestions that will make your table as user-friendly as possible:
Make row headers sticky when the table is horizontally scrolled. This will make sure the user still has some context when scrolling through the table. The only downside to this solution is that the user will have to remember all of the column headers if they scroll past them, but this is a tradeoff of this solution.
Put the most important columns being compared towards the front of the table so that users will see those first.

This comparison table of NFL player stats does a good job of implementing sticky row headers when scrolled horizontally. However, because the column headers cannot be sticky, the user loses the context of the columns, which increases cognitive overload.
One thing that might benefit this table is adding a prepended string in front of each table data cell on mobile devices so that when the user scrolls horizontally and/or vertically, they will still know which items are being compared.
You want users to weigh the pros and cons of your offerings.
For product- or service-based comparison tables, users might want to know the positives and negatives of each different offering. If your products or services provide different benefits for users, a comparison table is an optimal way of letting the user decide what they should choose. In fact, the comparison is one of the most critical activities on the web, and in many cases, it’s a necessary step before your site visitors will perform a desired action (Source: the Nielson Norman Group), whether it’s enrolling in a course, purchasing a product, or becoming a member.
Consider the following example from Apple.com, which uses a comparison table to list out the different attributes of 3 different apple watches. When a user looks at this table, they can clearly see what each watch has to offer and what each might be lacking by horizontally scanning the table rows.

Apple does a relatively good job of utilizing a comparison table to show the similarities and differences of 3 different Apple Watches. They kept the number of items being compared to 3, which makes this chart less overwhelming for a user. There are three things that can be improved:
The dash “-” symbols signifying that an attribute is missing should be consistent with the rest of the table by using words or phrases to signify if an attribute is included or not.
The table should have row headers to the left of the table so that users know what attributes are being compared. For instance, the last row could have a row header “Family Setup”, and the table cell content for the three products could be “Pair multiple watches with one iPhone”, “Pair multiple watches with one iPhone”, “N/A”.
This table does not use adequate web-accessibility features that a table should have. Learn more about what makes a comparison table web-accessible.
Think your offerings are a good candidate for a comparison table? Generate your own custom comparison table for your website using the Comparison Table Generator, which lets you add up to 4 products or service offerings. If you are interested in learning how to construct a responsive and web-accessible product comparison table using HTML, you might enjoy my article How to Create a Responsive Product Comparison Table with HTML & CSS.